dsh-token-stats
Run the following command in DeepSeek Harness:
dsh plugin install 1148281964/dsh-token-stats
Paste the following prompt into your AI chat to install this plugin:
Run dsh plugin install 1148281964/dsh-token-stats in the DeepSeek Harness CLI, or manually download the package from https://github.com/1148281964/dsh-token-stats into the packages/ directory of your profile and restart Harness.
About this plugin
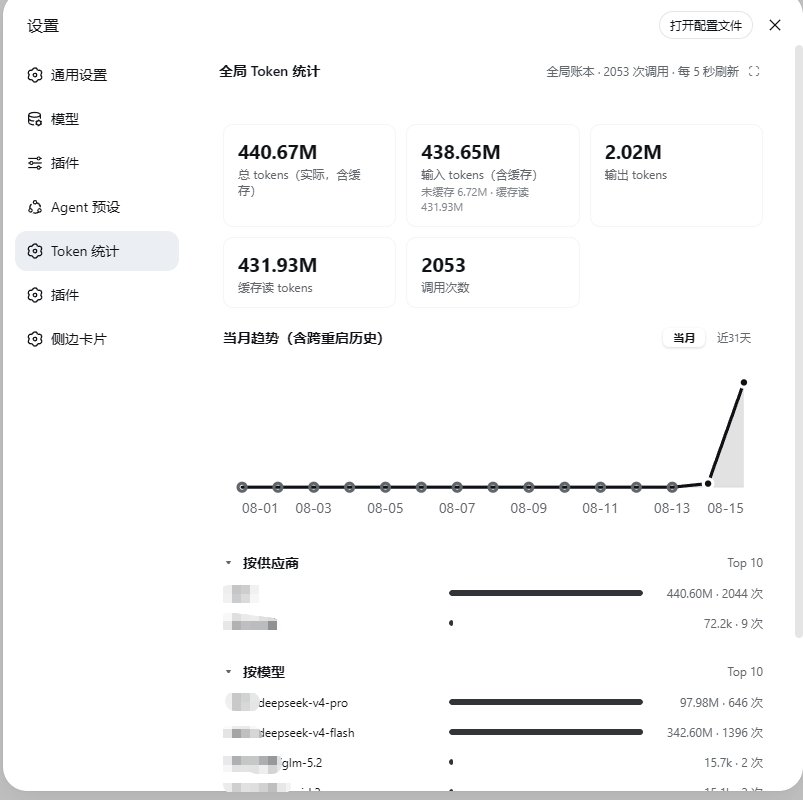
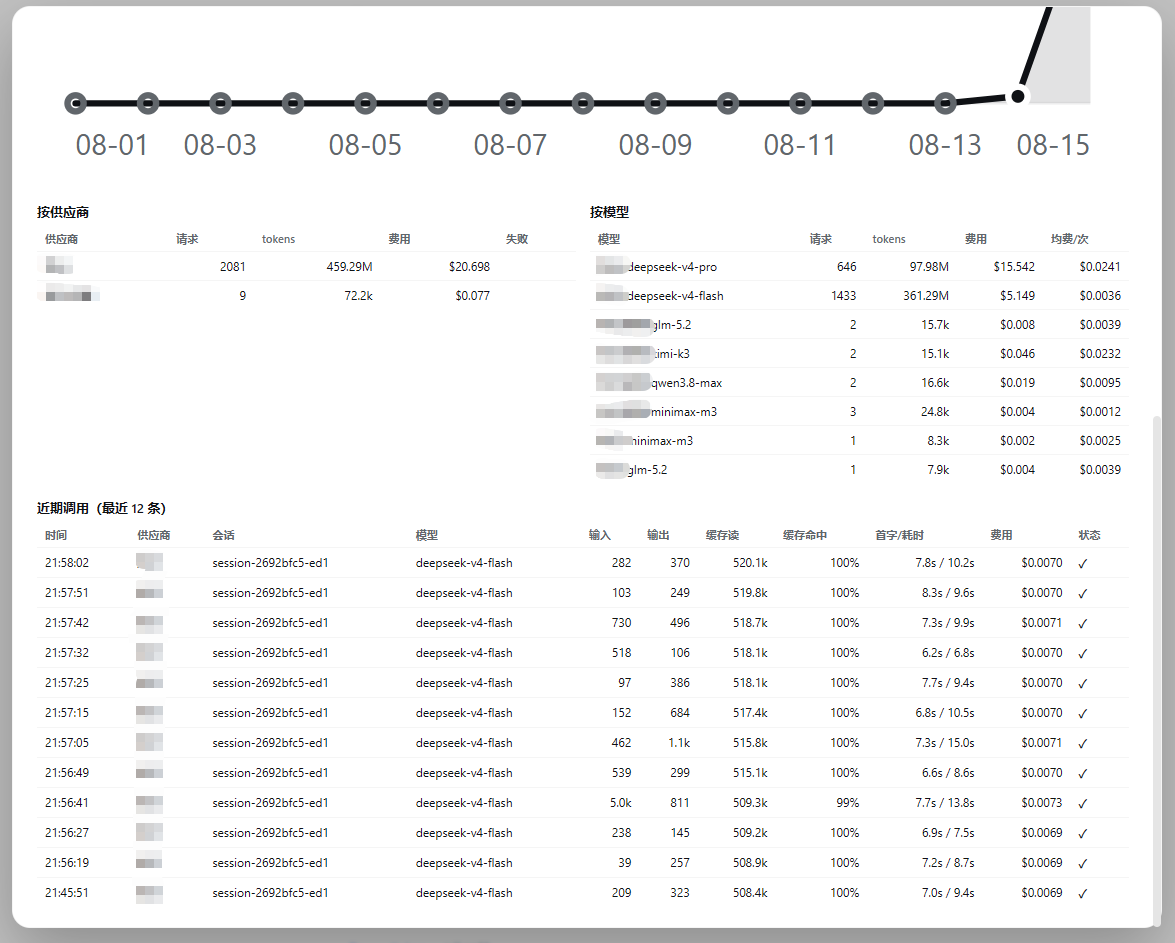
If you have been running DeepSeek Harness for a while, you probably noticed that per-call token costs, model-level burn rates, and cache hit rates are scattered across logs with no single place to look. dsh-token-stats fills that gap: it intercepts every llm/stream call, records the real usage figures (input, output, cache read/write, and reasoning tokens) rather than estimates, and appends them to a durable local JSONL ledger that survives restarts and hot reloads.
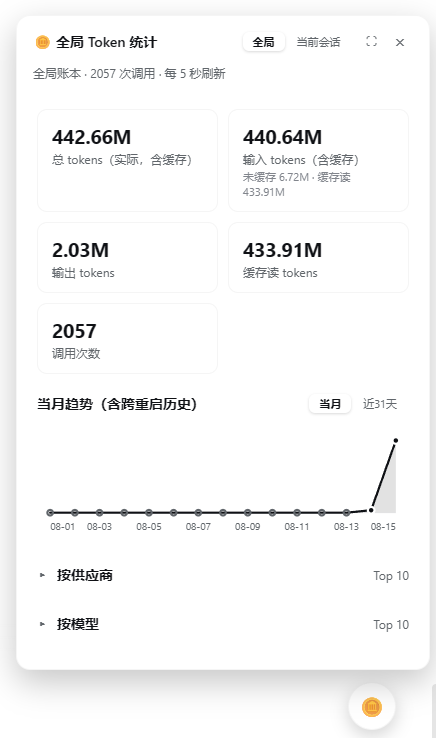
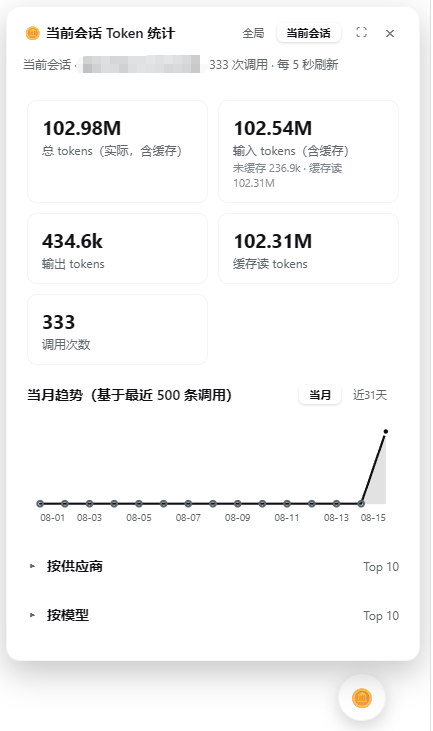
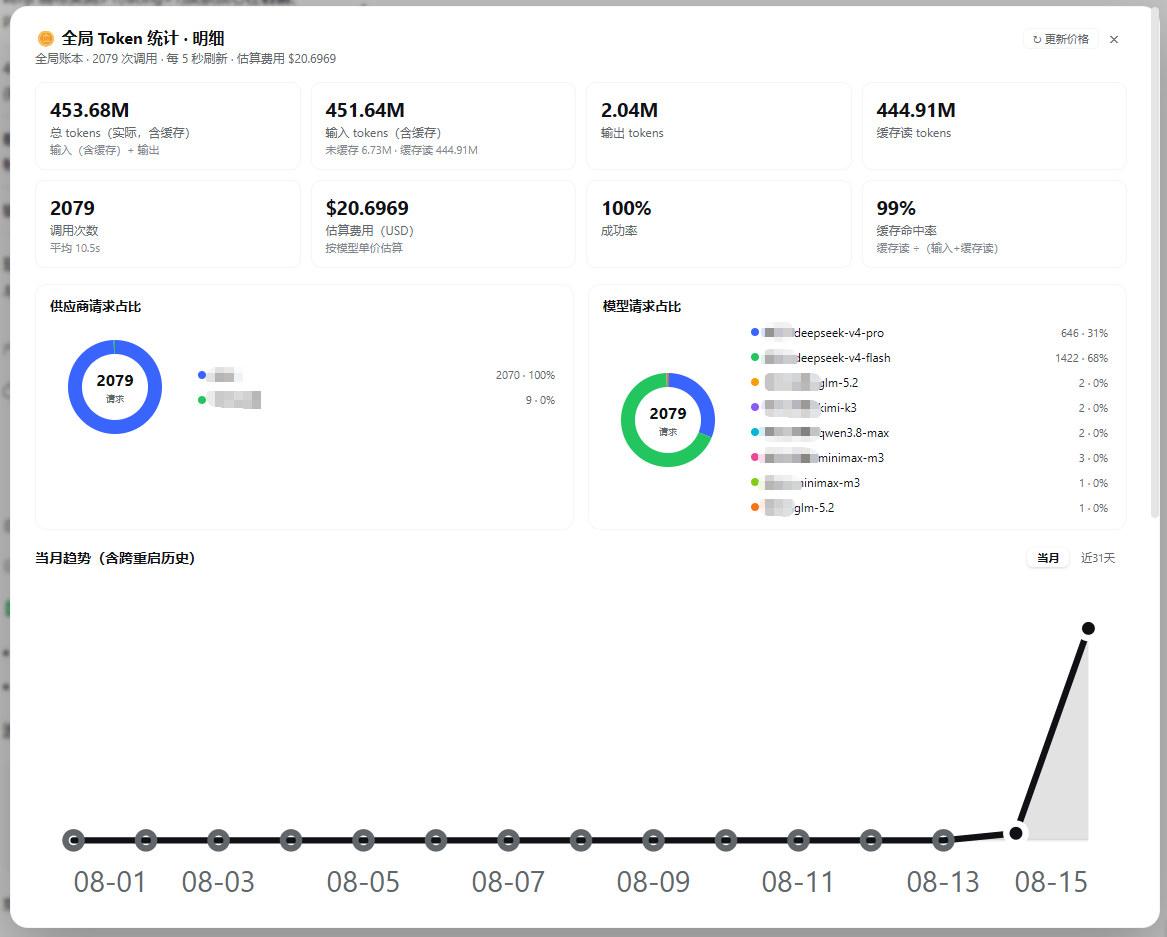
On top of that ledger, the plugin aggregates across four dimensions—provider, model, session, and date—and pairs the numbers with cost estimates driven by OpenRouter live pricing. It also tracks cache hit rate, success rate, and time-to-first-token (TTFT). A draggable floating button in the bottom-right corner lets you toggle between global and current-session views at a glance; clicking it open reveals a full-screen dashboard with KPI cards, a request-share donut chart, a 31-day trend line, and per-model breakdowns. Models can also query the stats directly through the token_stats tool, and a backfill script can import calls made before the plugin was installed from historical session files.
If you are juggling several providers, trying to figure out which pipeline is eating your budget, or simply want a clear receipt for every conversation, this plugin fits the bill nicely. It is pure JavaScript with no build step—drop it into the packages directory, restart, and it is ready to go.
Screenshots


Use Cases
- Real-time comparison of token burn and cost across multiple providers
- Diagnosing low cache hit rate or high TTFT in a specific session
- Producing a monthly token usage and cost report for the team
Best For
- Harness users juggling multiple LLM providers
- Developers who care about API cost and cache efficiency
- Ops engineers who need to produce usage receipts for teams or clients
Related Plugins
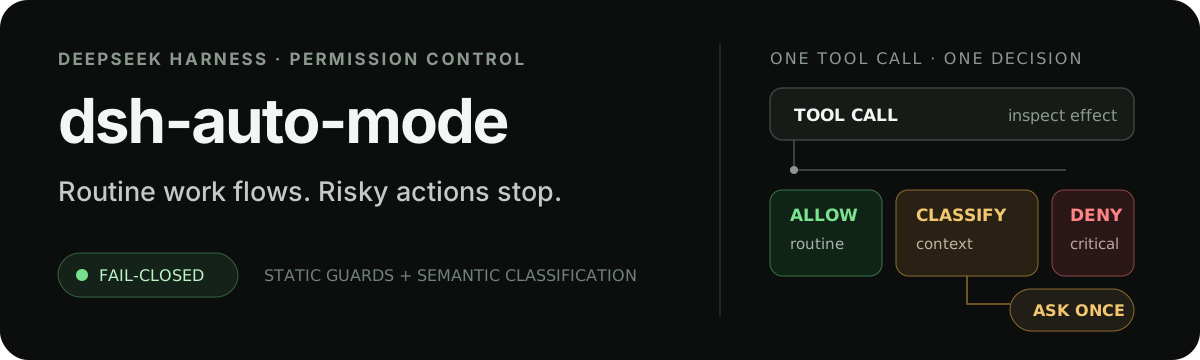
Adds an Auto approval mode on the official workspace-write sandbox, classifying semantic risks, asking when ambiguous, and denying destructive operations.

Undo/rollback system for DSH: config & plugin snapshots, one-click undo/redo/restore, message-level revert, secret masking, safe mode, and offline WebUI/GUI/CLI rescue tools for when DSH won't start.
Packages all 87 SKILL.md files from upstream reverse-skill as a DeepSeek Harness plugin that auto-registers them for authorized reverse engineering, penetration testing, and security research.
Dockyard DSH is a native DeepSeek Harness plugin that unifies official OAuth/client sessions for Codex, Antigravity, Grok, Claude, and Cursor, providing account pool, model catalog, and quota status.