dsh-observability
Run the following command in DeepSeek Harness:
dsh plugin install CodePrometheus/dsh-observability
Paste the following prompt into your AI chat to install this plugin:
Run dsh plugin install CodePrometheus/dsh-observability in DeepSeek Harness to install this plugin (source: https://github.com/CodePrometheus/dsh-observability).
About this plugin
The official DeepSeek Harness telemetry Service Definition exports OTLP logs only, leaving the trace dimension unaddressed. dsh-observability is a community plugin that registers a second Service Provider on that same definition, collapsing every agent session into an OTLP span tree and shipping it to any collector that accepts OTLP/HTTP (Jaeger, Grafana Tempo, Datadog, etc.), filling the gap in distributed tracing for LLM agent workloads.
The span mapping is straightforward: each turn becomes the trace root span, each model step becomes a child span tagged gen_ai.operation.name=chat, and each tool call becomes a grandchild span tagged execute_tool. Every span carries the full GenAI semantic-convention attribute set including model name, provider, all five token usage counters (input, output, cache read, cache write, reasoning), time-to-first-chunk, error codes, and status. Three modes (FULL, FEEDBACK_ONLY, DISABLED) govern data egress; the default is DISABLED so nothing is constructed or sent. Trace and span IDs are derived from session.id, turn, and step rather than randomly generated, meaning a live capture and a FEEDBACK_ONLY canonical-log replay of the same events produce byte-identical trees and duplicate hand-offs are idempotent at the receiver. Spans left open by a missing terminal event are closed by a force-end sweep and marked dsh.force_ended. The plugin is purely observational: it never assembles or sends a provider request and has no KV-cache effect.
It suits teams that already run an OTLP collector and want to fold dsh agent sessions into their existing APM or compliance pipeline, developers who need per-turn token cost attribution and TTFB analysis, and contributors looking to extend the dsh observability stack at the community level. Keep in mind that the plugin ships no built-in redaction rules, so deployments exporting beyond a trusted boundary must mount their own waterfall listeners, and a context accepts exactly one telemetry backend: running both the official logs provider and this traces plugin simultaneously requires a multi-sink evolution upstream.
Use Cases
- Export dsh agent sessions as OTLP span trees into Jaeger or Grafana Tempo
- Analyze per-turn token usage, time-to-first-token, and tool-call latency at step granularity
- Trace the full multi-step reasoning call chain during compliance audits
- Attach GenAI semantic-convention attributes to every model and tool span
Best For
- APM and SRE teams already running an OTLP collector pipeline
- Application developers who need per-turn token-cost attribution and TTFB analysis
- Community contributors extending the dsh telemetry stack
Related Plugins
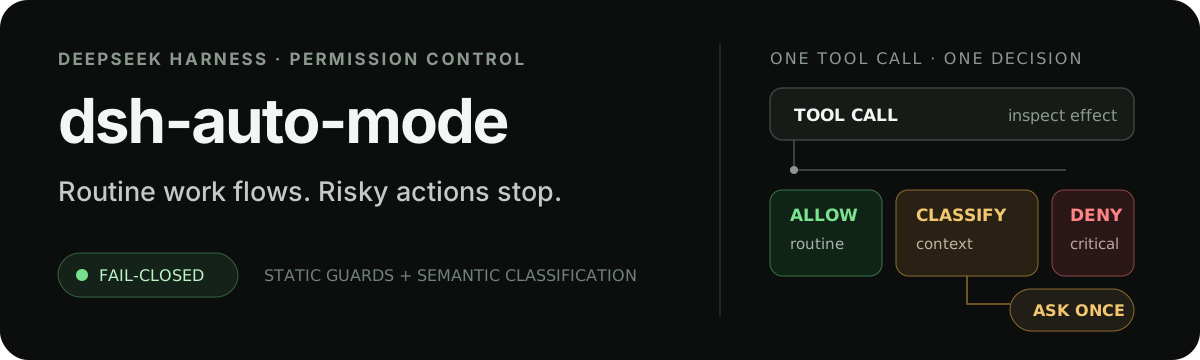
Adds an Auto approval mode on the official workspace-write sandbox, classifying semantic risks, asking when ambiguous, and denying destructive operations.

Undo/rollback system for DSH: config & plugin snapshots, one-click undo/redo/restore, message-level revert, secret masking, safe mode, and offline WebUI/GUI/CLI rescue tools for when DSH won't start.
Packages all 87 SKILL.md files from upstream reverse-skill as a DeepSeek Harness plugin that auto-registers them for authorized reverse engineering, penetration testing, and security research.
Dockyard DSH is a native DeepSeek Harness plugin that unifies official OAuth/client sessions for Codex, Antigravity, Grok, Claude, and Cursor, providing account pool, model catalog, and quota status.