dsh-prometheus
Run the following command in DeepSeek Harness:
dsh plugin install xxiaoxiong/dsh-prometheus
Paste the following prompt into your AI chat to install this plugin:
To install this plugin in DeepSeek Harness, please use the command dsh plugin install xxiaoxiong/dsh-prometheus. Source: https://github.com/xxiaoxiong/dsh-prometheus
About this plugin
Developing and operating DeepSeek Harness often presents challenges regarding observability, making it difficult to monitor Agent status, tool efficiency, and potential errors in real-time. The dsh-prometheus plugin addresses this by providing standard Prometheus metrics endpoints and ready-to-use Grafana dashboards, significantly simplifying system monitoring. It not only precisely tracks critical metrics such as active sessions, Agent turns, background jobs, and LLM request rates but also incorporates strict privacy protection to ensure no sensitive data—such as system prompts, conversation content, or tool execution results—is leaked.
Use Cases
- Real-time monitoring of DeepSeek Harness Agent status and performance metrics.
- Analyzing LLM request latency, tool success rates, and system throughput.
- Quickly identifying anomalies and bottlenecks in Agent execution via Grafana dashboards.
Best For
- DevOps engineers responsible for DeepSeek Harness deployment and maintenance.
- Developers needing deep analysis of Agent behavior and performance.
- Operations staff focused on system observability and data security.
Related Plugins
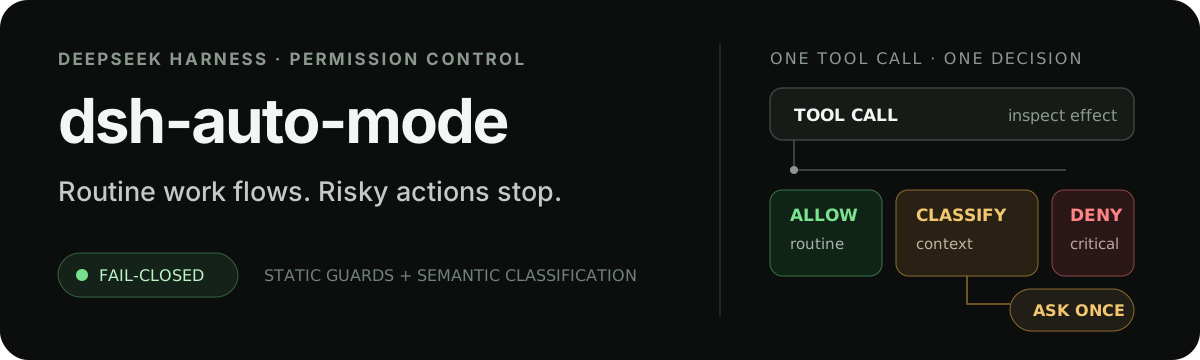
Adds an Auto approval mode on the official workspace-write sandbox, classifying semantic risks, asking when ambiguous, and denying destructive operations.

Undo/rollback system for DSH: config & plugin snapshots, one-click undo/redo/restore, message-level revert, secret masking, safe mode, and offline WebUI/GUI/CLI rescue tools for when DSH won't start.
Packages all 87 SKILL.md files from upstream reverse-skill as a DeepSeek Harness plugin that auto-registers them for authorized reverse engineering, penetration testing, and security research.
Dockyard DSH is a native DeepSeek Harness plugin that unifies official OAuth/client sessions for Codex, Antigravity, Grok, Claude, and Cursor, providing account pool, model catalog, and quota status.